Airbnb Spreadsheet Template for 3+ Properties (Free, 2026)
Most Airbnb spreadsheets break at 3 properties. Here's what to look for in a multi-property template — plus our free Google Sheets version that scales.
Free Template
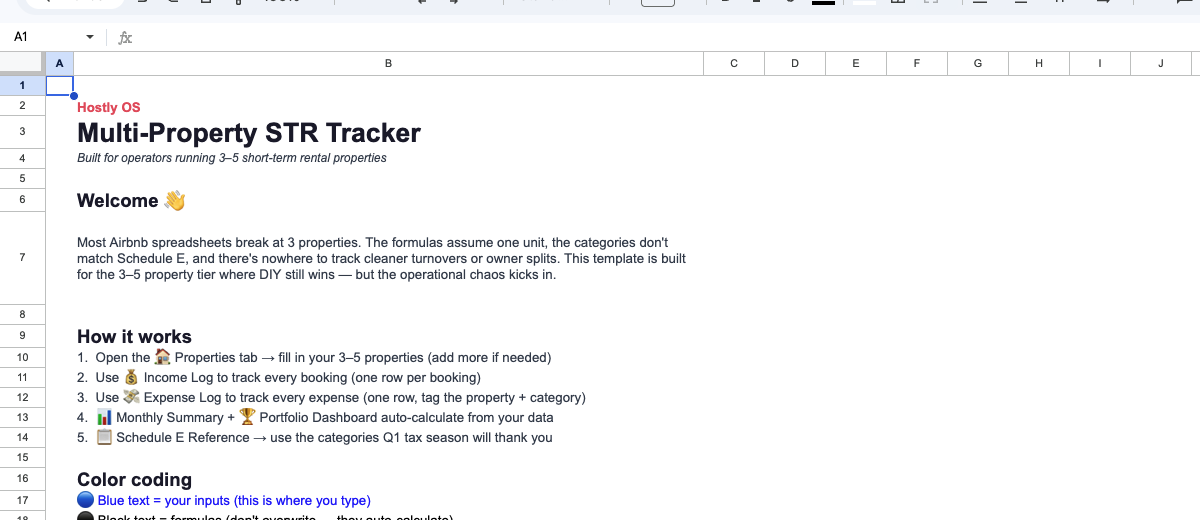
Multi-Property STR Tracker
Property P&L, Schedule E categories, occupancy dashboard. Built for 3–5 properties.
Preview of the tracker — get your own editable copy below.
Most Airbnb spreadsheet templates break at the same point
Not on day one. Around month three, when a third property comes online and the formulas start returning #REF! errors at the worst possible moment.
That’s the pattern we’ve seen over and over — hosts find a template that looks solid, plug in their numbers for one or two properties, things seem fine. Then they add a property. Or a co-host. Or a cleaning team. Or they try to do their taxes. And the whole thing collapses.
Free ones from forums, paid ones from Gumroad, a few clearly copied from YouTube tutorials — they share the same flaw. The problem isn’t that they’re bad spreadsheets. Most are fine — for one property. The problem is they were never designed to scale, and nobody warns you about that until you’re already three properties deep and behind on your bookkeeping.
This post covers why single-listing spreadsheets fail at scale, what a multi-property template actually needs to track, and what we built for the Hostly OS toolkit. If you’re managing 3–5 properties, you’ll know whether you need to rebuild from scratch or just patch what you have.
Why single-property Airbnb templates fail at 3+
The failure mode is predictable. Here’s what actually breaks.
The formula architecture assumes one unit
Almost every template you’ll find on Google has this structure: a single “Bookings” tab with a property column, a “Monthly Summary” tab that aggregates it, and maybe a “Expenses” tab bolted on the side.
That works at one or two properties. At three, you need filtered views per property. At five, you need cross-property comparisons — your RevPAR (Revenue Per Available Room) by property, your net income by unit, your cleaning cost as a percentage of revenue for each address separately.
The formula patterns that work for one property (SUMIF on a single column) don’t scale cleanly. You end up copying tabs, manually naming them “Property 1 Income,” “Property 2 Income,” and suddenly you have 15 tabs and no single source of truth.
Tax categorization is an afterthought
Most free templates have an “Expenses” tab with columns like Date | Amount | Category | Notes. That’s it. For tax purposes, you need:
- Expense type (operating vs. capital vs. mixed-use)
- Property attribution (which property the expense belongs to)
- Deductibility flag (100% deductible, percentage deductible, not deductible)
- Receipt reference (so you can match your spreadsheet to your bank statements at year-end)
Without property attribution, your Schedule E (the US tax form for rental income) becomes a manual nightmare. You’re allocating expenses by hand at tax time instead of just exporting a clean report.
Occupancy and revenue metrics aren’t connected
Single-listing templates track bookings. They don’t track performance. You’ll find columns for Check-in | Check-out | Guest Name | Payout. That’s a booking log, not an analytics tool.
What’s missing: available nights vs. booked nights (occupancy rate), ADR (Average Daily Rate), RevPAR, cleaning fee as a percentage of nightly rate, OTA (Online Travel Agency) fee totals. These are the numbers that tell you if you’re actually running a profitable operation — not just that bookings happened.
At one property you can do this math in your head. At three or five, you need it calculated automatically, and you need it broken down per property so you know which unit is your strongest performer.
Co-host and cleaning team coordination is invisible
If you have a co-host, a cleaner, or a VA (Virtual Assistant) handling any part of operations, a single-listing spreadsheet has no structure for it. No assignment tracking. No task status column. No way to see “who confirmed the turnover for Unit 2 on Saturday.”
This isn’t just an ops problem. It’s a money problem — if you’re paying a co-host a percentage, you need to calculate their cut from that property’s net revenue, not your total portfolio revenue.
Cash flow visibility disappears
When your Airbnb payouts land in your account, they’re already net of fees. But your spreadsheet needs to show gross revenue (what guests paid) and fees (what Airbnb kept) separately — not just the payout amount.
Single-property templates often skip this split. You end up with accurate cash flow tracking but no idea what your actual gross revenue was, which matters for pricing decisions and for comparing your Airbnb performance against direct booking revenue.
What a multi-property spreadsheet actually needs
Seven features that have to be present before a template is worth using at 3+ properties.
1. Property master list with unique IDs
Every entry in every tab — bookings, expenses, maintenance, tasks — should reference a property ID, not a property name. Names change (“Unit 2B” becomes “The Garden Suite” when you rebrand). IDs don’t.
Your master list should have: property ID, address, listing URL, platform (Airbnb/Vrbo/direct), monthly fixed costs (mortgage or rent, insurance, base utilities), and co-host split percentage.
This one structure underpins everything else. Every SUMIF, FILTER, and pivot table in the spreadsheet should reference the ID column.
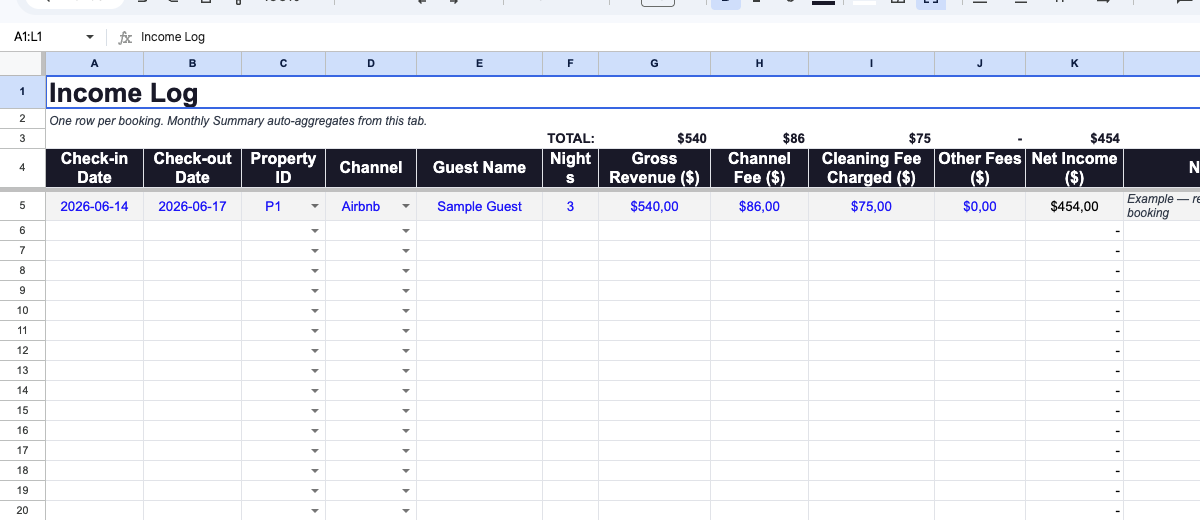
2. Booking log with platform + channel data
Bookings tab should capture: property ID, platform (Airbnb, Vrbo, direct), check-in, check-out, number of nights, gross booking value, cleaning fee charged, Airbnb service fee (host portion), net payout, guest name (optional), and booking status.
The platform column matters because you’ll eventually want to compare your Airbnb RevPAR against your Vrbo RevPAR for the same property. You can’t do that if all bookings are in a single undifferentiated list.
3. Expense log with full tax attribution
Property ID, date, vendor, category, amount, receipt reference, deductible percentage, notes.
Categories should map to Schedule E lines — not just “cleaning” and “supplies.” You want: Advertising, Cleaning, Commissions, Insurance, Mortgage Interest, Other Interest, Repairs, Supplies, Taxes, Utilities, Depreciation (flagged separately, calculated outside the spreadsheet). This makes tax prep a matter of exporting and sorting rather than re-categorizing everything in April.
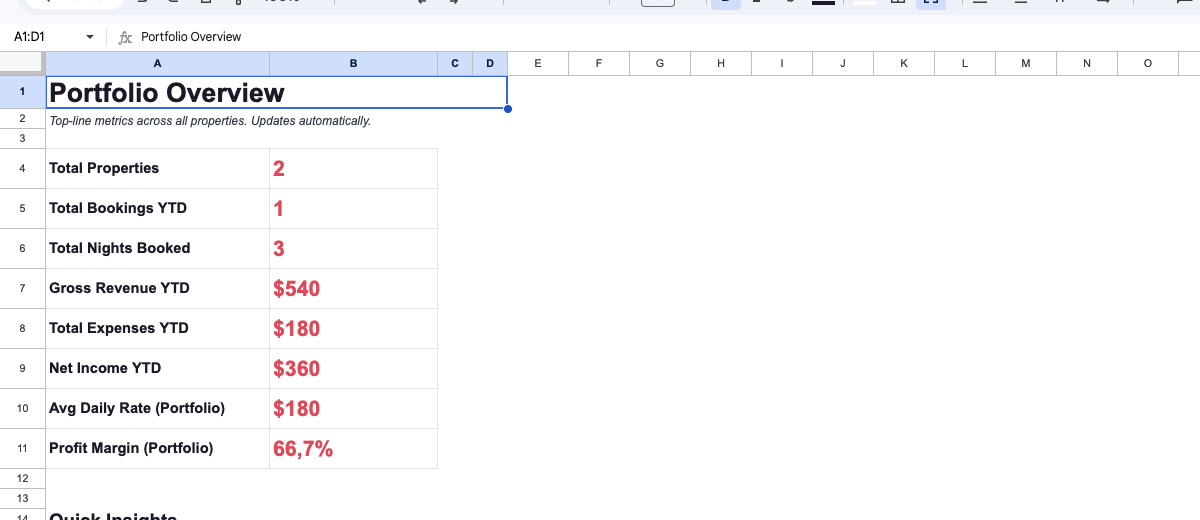
4. Per-property performance dashboard
Auto-calculated metrics that update as you add bookings: total revenue (gross), total expenses, net operating income, occupied nights, available nights, occupancy rate (%), ADR, RevPAR.
This should be filterable by month and by property. The goal is to answer “how did Unit 3 perform in March compared to February” without having to manually sum anything.
5. Cash flow tracker with payout reconciliation
A tab that matches your Airbnb payouts to the bookings in your log. You enter the payout date and amount, the template finds the associated bookings, and you reconcile any discrepancies.
This is boring. It’s also how you catch when Airbnb processes a refund you didn’t know about, or when a payout is short by $40 and you can’t figure out why.
6. Maintenance and capex log
A separate log for non-recurring expenses: repairs, appliance replacements, renovations. This stays separate from your operating expenses tab for two reasons. First, capex is depreciated differently from operating expenses. Second, you need to know your maintenance cost per property over time to make smart decisions about whether to keep or sell an asset.
Columns: property ID, date, description, vendor, cost, category (repair vs. improvement), asset life estimate (for depreciation), notes.
7. Monthly close checklist
A simple tab with a checklist you run through at month-end: reconcile payouts, categorize new expenses, update occupancy numbers, flag anything that needs a receipt, review co-host calculations.
This sounds unnecessary until you realize that most bookkeeping disasters happen because someone skipped two months of close and then tried to reconstruct everything in January. A 15-minute monthly close prevents a 12-hour tax-season catch-up.
The Hostly OS spreadsheet template
We built a Google Sheets template that covers all seven of the above — property master list, booking log with platform tracking, expense log with Schedule E categories, per-property dashboard, payout reconciliation, maintenance log, and monthly close checklist.
It’s designed for 3–5 properties. It scales cleanly to 8–10 before you start hitting Sheets performance limits. It doesn’t require any add-ons, scripts, or paid Google Workspace account.
What’s currently available
Get the Free Multi-Property Tracker
The Google Sheets template referenced in this guide — property P&L, Schedule E categories, occupancy dashboard. Free download.
It’s not published yet because we’re still stress-testing the payout reconciliation tab with real data from a 4-property portfolio. We’d rather ship it right than ship it fast and have operators hit #VALUE! errors in their expense log.
If you subscribe, you get: the template the day it’s ready, the setup walkthrough video (10 min, no fluff), and the Lodgify vs Hostaway comparison PDF that goes with this series.
Customizing the template for your portfolio
Once you have the template, three things to set up before you enter a single booking.
First: configure your property master list. Assign IDs (P1, P2, P3 — keep it simple), enter your fixed monthly costs for each property, and set your co-host split percentage if applicable. Every other formula in the sheet references this tab, so getting it right up front saves you from chasing down broken references later.
Second: set your expense categories. The template ships with Schedule E categories as defaults. If you have expenses that don’t fit neatly — HOA fees, property management fees, local STR (Short-Term Rental) permit renewals — add them to the category dropdown and add a row to the tax summary tab. Don’t use “Other” for things that recur; they’ll confuse you in 8 months.
Third: decide your reporting period. The dashboard defaults to calendar year, but if your tax year is different or you track performance by quarter, adjust the date filter logic in the dashboard tab. The formulas use named ranges so you can do this without breaking anything.
One thing worth doing from the start: track cleaning fees as a separate revenue line, not as a deduction from payout. Airbnb shows them separately in your transaction history, and keeping them separate in your spreadsheet makes it much easier to analyze whether your cleaning fee is actually covering your cleaning costs.
Running 3–5 properties? This tracker was built for you.
Get the free multi-property spreadsheet template
When you’ve outgrown spreadsheets
A spreadsheet handles 3–5 properties well if you’re consistent about entering data. It starts showing cracks around 6–8 properties — not because of technical limits, but because the manual entry burden compounds with each property you add.
The signs you’ve hit the ceiling:
- You’re more than 2 weeks behind on expense entry regularly
- You have a co-host or VA who needs their own access but you can’t give them partial access without sharing everything
- You need automated guest messaging, damage claim tracking, or dynamic pricing — none of which a spreadsheet can do
- You’re managing properties across multiple platforms and the reconciliation between them is taking more than 2 hours a month
At that point, a PMS (Property Management System) makes sense. We’ve compared Lodgify and Hostaway in detail — Lodgify vs Hostaway is the best starting point if you’re in the 3–8 property range and looking at channel management specifically.
What a PMS gives you that a spreadsheet doesn’t: automated payout syncing, guest messaging workflows, multi-calendar management, and owner reporting if you’re managing properties for others. What it doesn’t give you: the operational intelligence layer — the SOPs (Standard Operating Procedures), the cleaning coordination system, the financial analysis framework. That’s what Hostly OS is building on top.
FAQs
Can I use a free Airbnb spreadsheet template for tax purposes?
You can, but most free templates aren’t structured for tax preparation. You need expense categories that map to Schedule E lines and property-level attribution. Without these, you’ll spend significant manual time reorganizing data at tax time.
What’s the difference between a spreadsheet and a PMS for Airbnb?
A spreadsheet is a manual tracking tool. A PMS (Property Management System) connects directly to Airbnb, syncing bookings and payouts automatically. Spreadsheets are free and flexible; a PMS costs $50–$300/month but saves meaningful time at 6+ properties. For 3–5 properties, a well-built spreadsheet is usually sufficient.
How do I track expenses for multiple Airbnb properties in one spreadsheet?
A property ID column on every expense entry — not just a property name. This lets you aggregate expenses by property with SUMIF or FILTER formulas. Without property attribution, you’re allocating expenses manually at year-end.
Is Google Sheets or Excel better for Airbnb tracking?
Google Sheets for most operators. Real-time sharing with co-hosts or accountants without version conflicts, accessible from any device, free. Excel has more powerful analysis features but the collaboration friction usually outweighs that for 3–5 property portfolios.
What should I track in an Airbnb income spreadsheet?
At minimum: gross booking value, Airbnb fees, cleaning fees charged, net payout, property attribution. Beyond that: occupancy rate, ADR (Average Daily Rate), RevPAR (Revenue Per Available Room), and monthly expenses by category. The goal is to know, per property, whether you’re actually profitable — not just that money is arriving.
Get the template when it’s ready
The Hostly OS spreadsheet template is in final testing. It covers everything in this post — property master list, Schedule E expense categories, per-property dashboard, payout reconciliation, maintenance log.
Subscribe below and you’ll get it the day it’s published, along with the setup walkthrough and the Lodgify vs Hostaway comparison PDF.